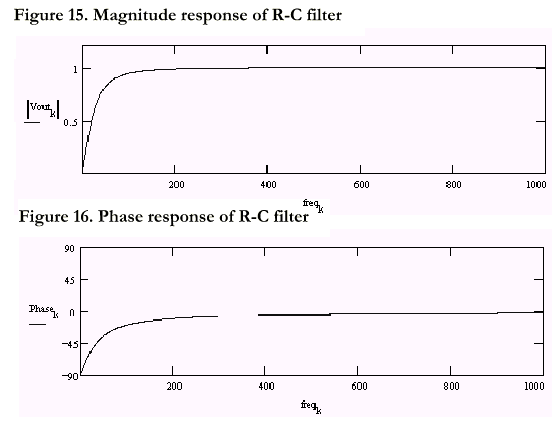
Analysis of logarithmic / logarithmic R-C frequency response curve
Several key features:
The characteristics of the network as a whole high pass filter.
The gain decreased to 0.707 or -3dB when the frequency of the high pass filter, called the "cut-off" or "angle" frequency.
When the resistor R and capacitor C is known, the frequency by F (c) =1/ (2 - RC) formula.
It was significantly lower than the cutoff frequency, a linear decline curve, the decreasing rate is +20dB/ ten octave (Huan Yan, frequency doubling, the amplitude of the signal is double), characteristics of this kind of characteristic and differential circuit network is the same, the change of the output and input ratio.
When the frequency is higher than the cut-off frequency, the curve is horizontal in the "gain", is proportional to the size of the output and input.
The filtering characteristic curve can be approximated by two straight lines intersect, but the value is actually an asymptotic curve, the cut-off frequency here into a straight line crossing, value is -3dB.
And then, the transmission characteristics of the filter on the frequency spectrum of the signal, the frequency domain of this curve is applied to any actual signal description, and derive the response curve can be transformed back into the time domain signal (output).
Some practical examples of the characteristic effect of this filter will be given later. For each signal, first, the time domain description of the ideal source (i.e., the waveform can be observed through the oscillograph) when the filter characteristic is absent, followed by its spectrum (can be obtained by the FFT (fast Fu Liye transform) algorithm provided by the analysis software). Then the filtering characteristics (all examples are the same, but the key is to see the effect, then, the input) complex spectrum by filtering characteristics of complex amplification, and inverse FFT transform to obtain the corresponding time domain description, which formed the engineers eventually expect the observed waveform.
Note: in figures 15, 16 and 17, the R~C values used to generate curves are R=1M ohm and C=4.5nF, respectively. In the following graphs, C value is reduced to 1.5nF. In order to explain the principles determined artificially by these values, the ratio is not marked on the curve. But the time wave can be read out, expressed in seconds on the X axis, and the frequency curve is expressed on the X axis by Hz. The cut-off frequency of R=1M omega and C=1.5nF is about 106Hz.
Figure 18 the R-C filter effect on the high frequency sine wave input waveform represents a relatively high frequency sine wave passing through the network. On the input spectrum, the signal is represented as a single spectral line with an appropriate frequency. The frequency is just below the "cut-off" frequency, so it is slightly attenuated by the network. The amplitude of the final input waveform is reduced, and the phase is slightly drifting.
1.) input waveform
2) input spectrum
3) filter characteristics
4) output spectrum
5) output waveform
Figure 19 influence of R-C filter on low frequency sinusoidal input waveform
The same as the above, but a slower sine wave. At this point the attenuation is much larger and the phase shift is larger. This is the case when a piezoelectric sensor is used to monitor the steady vibration of the "too slow" frequency. This phase characteristic may be significant when used as a control ring.
1) input waveform
2) input spectrum
3) filter characteristics
4) output spectrum
5) output waveform
Figure 20. the influence of the R-C filter on the input waveform of the harmonic string represents a harmonic string, and several discrete spectral lines are all below the cut-off frequency. The attenuation of each one is not the same, so the "balance" of the harmonic in the output signal is alternating.
1) input waveform
2) input spectrum
3) filter characteristics
4) output spectrum
5) output waveform |